metro map with multiple coloured lines displaying strategic moves made by Boijmans

Boijmans van Beuningen Reorganisation Strategy

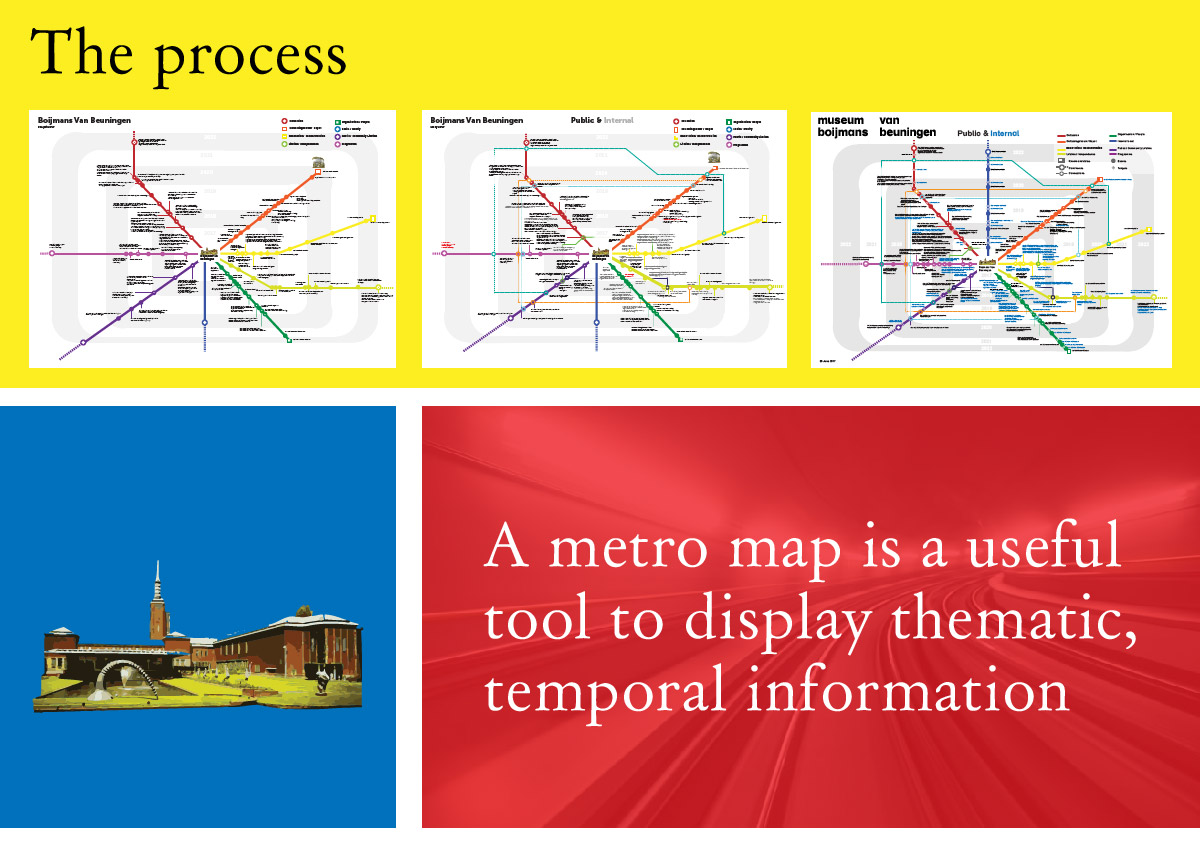
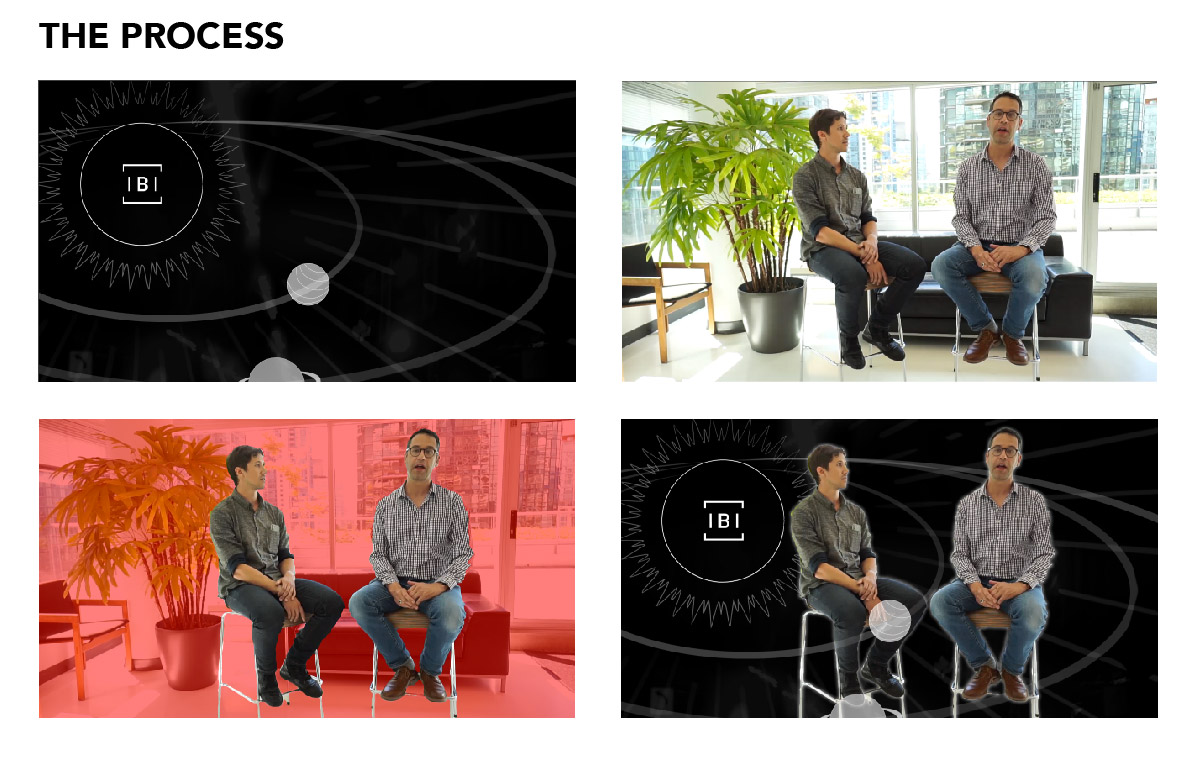
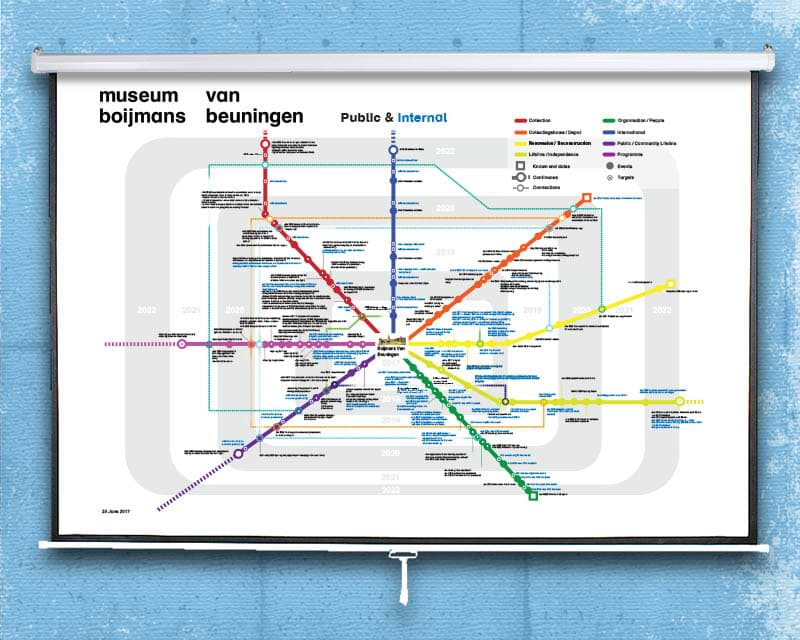
Boijmans van Beuningen is on the brink of major change; renovations and the construction of a new collection building are scheduled for the months to come. In the face of these changes, the administration saw this as the perfect opportunity to step back and re-examine the responsibilities of each department. I was contacted by Act to Be, a Dutch organisation that specializes in intrapersonal communication training, to participate in a design that could reveal all the major events in the coming five years and the many ways these elements were connected. After leading many in-person meetings and creative exercises with numerous members of the administration, a temporal infographic was designed to elucidate where the museum is going in the years to come, informing stakeholders, members, public officials or the very staff of the museum.
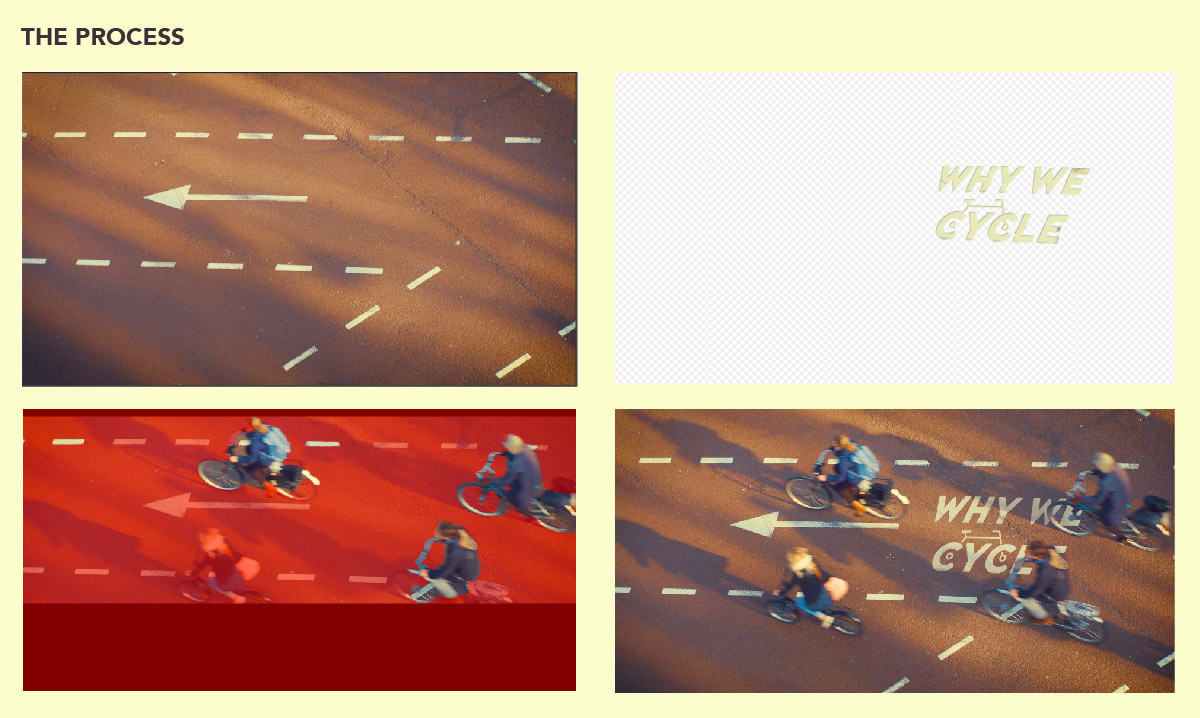
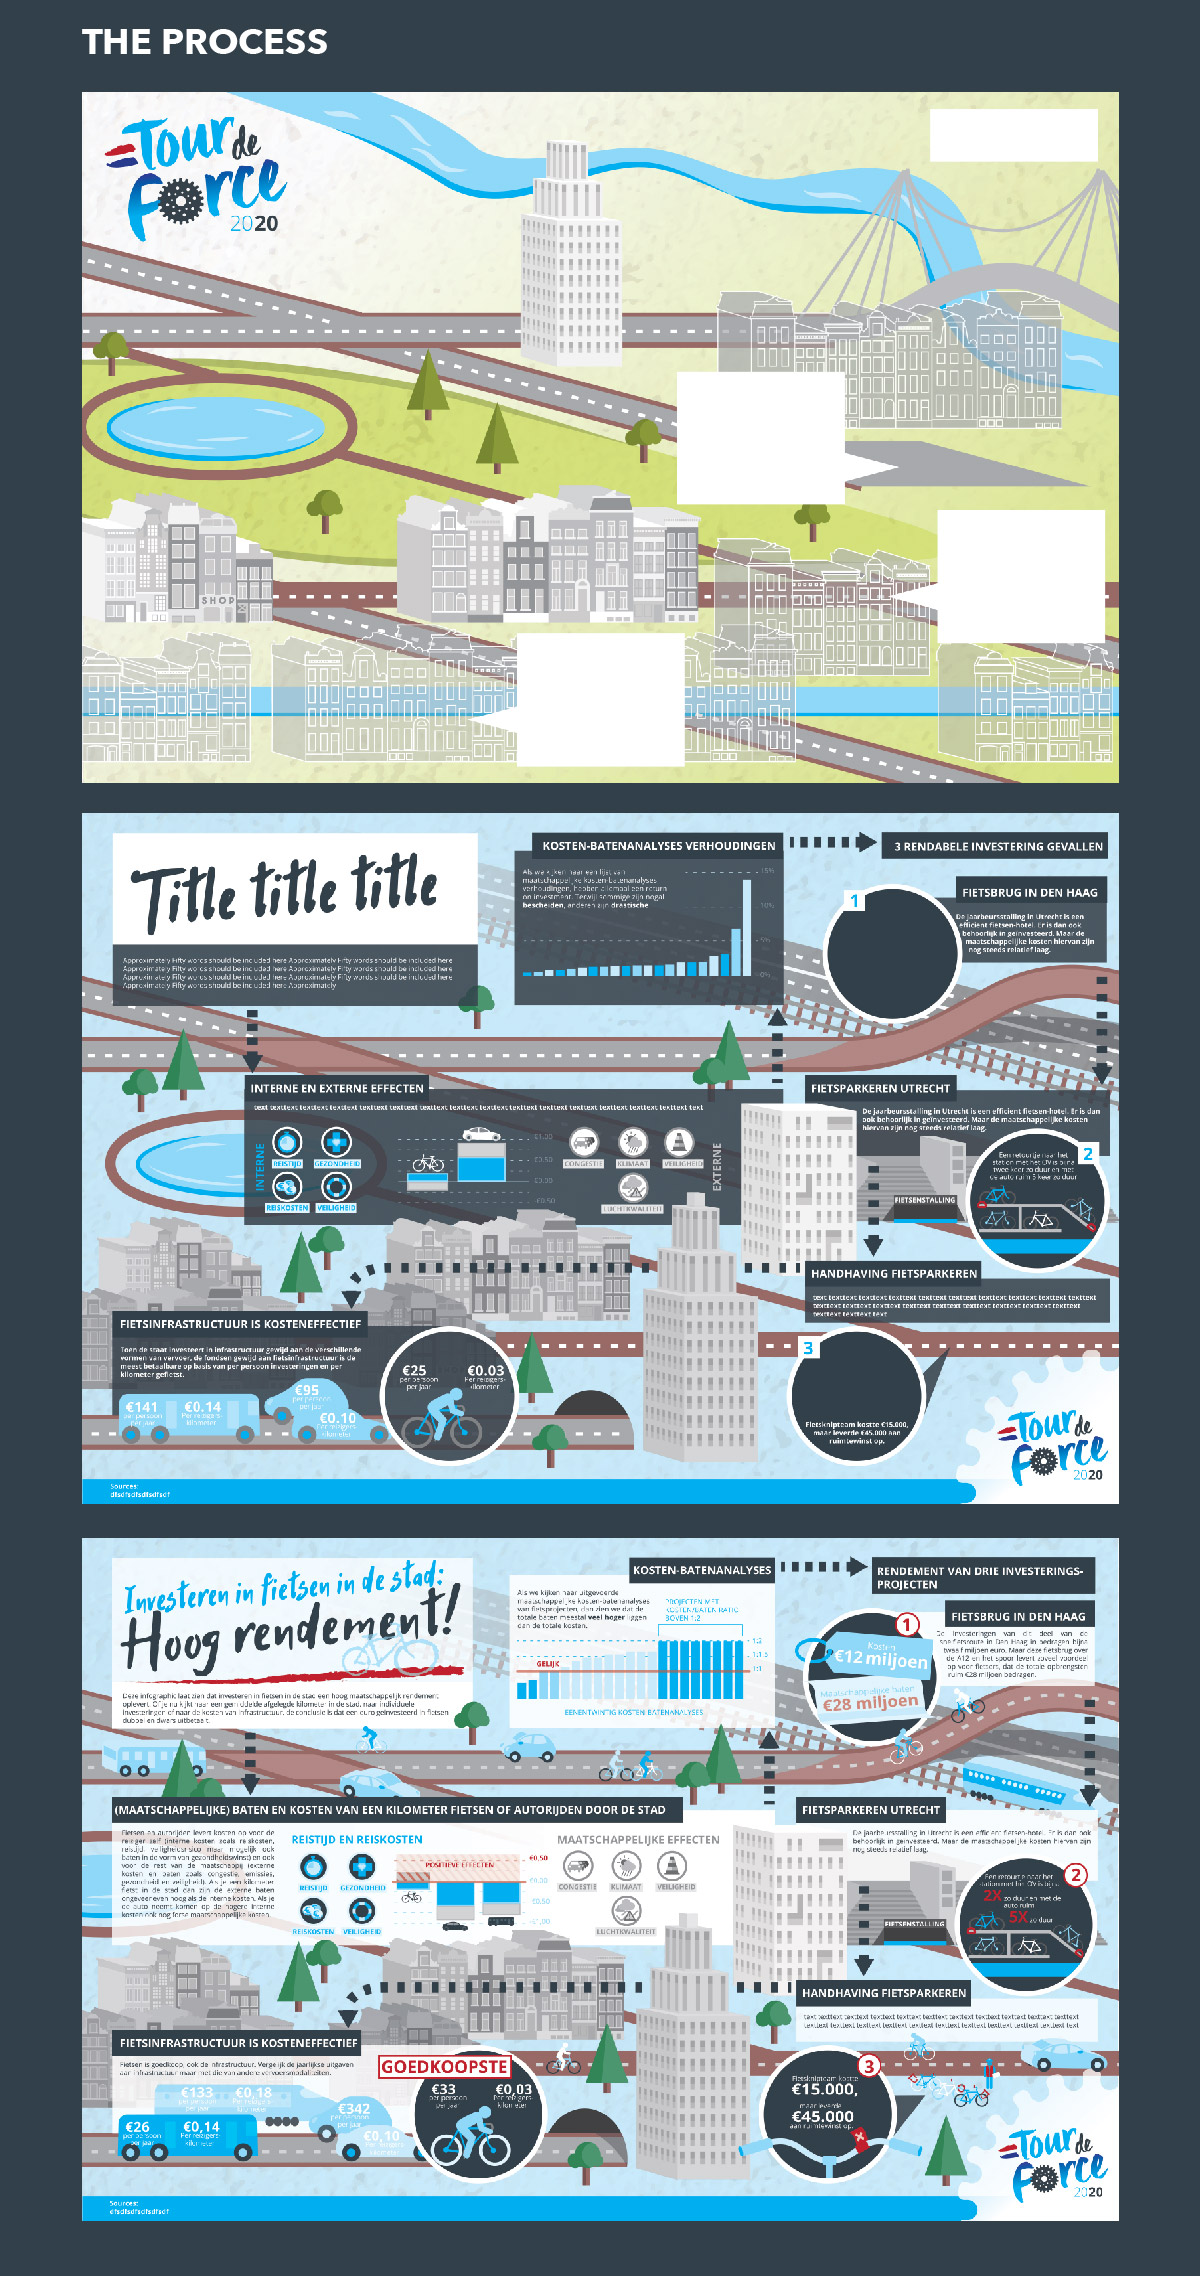
Posters, presentations and an animated walkthrough of the process were the outcome of this extensive process.
multiple coloured lines in a metro map for the strategic choices by Boijmans the process used to make the metro map small animation with tree growing as a mental map
NYC streetscape pop up augmented reality gif

Why Drive NYC

In 2017 Blank Space featured the Driverless Future Challenge. I was invited to participate with an international team and submit Why Drive NYC, a concept developed in collaboration with Mitchell Reardon, Daly Brown and Sebastien Goethals.  Working remotely with these talented urban planners resulted in a three-minute video proposal. The challenge in this project was limiting the very extensive plan for this new model of strategic urban design. The concept encouraged the public to participate in the design of public space, green space and autonomous mobility networks in neighbourhoods throughout New York City using gamification. Developing the materials from offices scattered across three different continents meant finding creative ways to depict the information. Google Street view and Google Earth provided an interesting medium to explore the streets and traffic of NYC and depict the need for a healthier balance between autonomous vehicles, pedestrians and cyclists in the future of the city.


google street view animation streetscape gif new york city streetscape transofrmation animation gif new york aerial photo cityscape with traffic gif

rotoscope why we cycle title screen animated gif

Why We Cycle – Animation

Arne Gielen and Gertjan Hulster from the production company, Nieuw en Verbeterd, contacted me to animate an opening title for their documentary about the cycling culture in the Netherlands.  Working with the talented designer, Riccardo Russomanno, an art direction was developed and a series of font styles were made into an hierarchy.  From here, I rotoscoped footage of a group of cyclists as they crossed a red bike path and then added the logo along with texture elements to make it appear weathered and as if it had been painted in place. I also animated maps to show patterns of cyclist movement throughout cities.


pocket r&d th!nk IBI intro title screen

TH!NK Pocket R&D VIdeo

IBI Group contacted me from their offices in Vancouver in order to produce a video for their new programme, TH!NK Pocket R&D.  Using footage from planners, senior managers and executives shot in offices across Canada, I animated, narrated and edited the footage to explain the purpose of the programme and encourage new participation. A lot of rotoscoping mixed with a hand drawn style made the video a fun and approachable.


santander smart buddy title page

Smart Buddy Santander

Smart Buddy was a project growing from a competition held by the European Regional Development Fund’s Urban Innovative Actions. The project included a new take on localized tourism by giving citizens of neighbourhoods the power to share their favourite restaurants, galleries, shops and more to visitors to Santander. Tonin is a visitor’s “Smart Buddy” guiding a visitor through the city and giving useful tips. The Smart Buddy team hired me to design, script, animate and edit a one-minute video to showcase the online service, both in English and in Spanish.  Fortunately for them, I did not narrate in Spanish.


process santander illustrations animate

Santander smart buddy on yellow background brush off your shoulders gifsantander landscape postcard animation gif

university of amsterdam book covers

Centre for Urban Studies – Book Cover Design

Oana Druta and Rowan Arundel from the Centre for Urban Studies at University of Amsterdam hired me to design the cover illustrations for their books, visualise their research data and format their writing. I developed a template for the format and then worked through it to ensure the entire document to ensure consistency and readability.

play the city illustrations

Play the City Book Illustrations

Play the City hired me to make a series of illustrations to appear in their new book, Play The City: Games Informing the Urban Development, by Ekim Tan. The illustrations were to appear at the starting pages of each chapter to explain in a simple and visual way how the game was to be played. I also was hired to make a collection of icons throughout the publication.


social cost benefit analysis of cycling in netherlands infographic

Tour de Force 2020

Tour de Force 2020 is the national initiative to increase bicycle ridership across the Netherlands by 20% over the next three years. The policy combines the goals and strategies of governments at the municipal, regional and national level. While working with the economic consultancy firm, Decisio, I was hired to make an infographic of the return of investment that cycling can bring, based on the research completed by Decisio.  The infographic appeared across the web, spread far and wide on social media and was central to the official document, “Agenda Fiets 2017-2020.” I developed an infographic that covered the most important details of the findings, showing how when governments invest in cycling infrastructure, the return on the invest is overwhelming. I helped translate the Dutch version into English and worked extensively to edit the content into its simplest and clearest form.


sustainable amsterdam brochure designs and business cards

Sustainable Amsterdam Branding

Sustainable Amsterdam is a consultancy firm based in Amsterdam showcasing the city’s many innovative approaches to urban planning, resiliency and sustainable mobility. The team’s work invites many occasions to show off their prowess at meetings or conventions across Europe.  Having attractive and inviting visuals is essential when these connections are made. Sustainable Amsterdam hired me to designs pamphlets, business cards, and tour leaflets that strengthened their brand identity and captured the spirit of their organisation.

university of amsterdam animated gif housing pop ups

Centre for Urban Studies, UvA

The Centre of Urban Studies at the University of Amsterdam started a department called Houwel to research the state of housing and welfare policies in governments from around the world. The team won a grant to fund the dissemination of their work in new and creative ways. Researchers in this department contacted me with the intention of making a three-part animated infographic series. Over the next several months, I worked alongside the research team to script, record, animate and edit the content into 3-4 minute videos that shared the main findings from their multiyear research. As part of the process, I developed the art direction, audio engineering and extensive animation.  The results were shared across social media and published online in the Telegraph.

bikenomics infographic amsterdam

Bikenomics Amsterdam – City of Amsterdam, Decisio

The economics consultancy firm, Decisio, was commissioned by the City of Amsterdam to perform a social cost benefit analysis of the impacts of cycling in the city.  They hired me to make an infographic of the contents that would accompany the report prepared for the city council.  The infographic was divided into quadrants under the various themes, all painting the picture of the positive effects that cycling has for the municipality and its residents.  I also translate the Dutch version into English for this project.


bike sharing policy velocitta

10 Golden Rules of Bike-Sharing – Velocitta

Velocitta was an EU funded project to determine the best policy goals for cities to implement and maintain an efficient bike-sharing schemes.  At the end of the three-year project, all of the collected data was compiled into “10 Golden Rules for Bike Sharing.” A video was designed to showcase these guidelines in and interesting and accessible way. I worked alongside the facilitator of the project, Pascal van den Noort to write and record a script, develop a storyboard and animate the video into a three-minute video.  The results were shared at the final conference of the project and have been circulated extensively in the active transportation arena.

infographic blue

Wikken en Wegen – CROW & Decisio

CROW is a nonprofit working with governments, contractors and consultants to share knowledge and establish best practices in the fields of innovation, transportation and security. Wikken en Wegen in the process they developed to help guide partners through the process.  Working alongside Decisio, I developed an infographic to highlight the steps in the process.


mobility policy infographic electric vehicles

Effectiveness of E-mobility Policy – Decisio

Decisio worked alongside APPM on a report for the Netherlands Enterprise Agency to determine the effectiveness of electric vehicle policies and different levels of government.  I was asked to represent the information into an infographic that could accompany the final report and be spread on social media.  The infographic was first written in Dutch before I helped with the English translation.


sustainable amsterdam animated gif map flight

Sustainable Amsterdam Promotional Video

Sustainable Amsterdam is a consultancy firm based in Amsterdam that showcases the city’s many innovative approaches to urban planning, resiliency and sustainable mobility. Part of the research formed the basis of “Are Streets for Cars” a short video demonstrating the changes to Amsterdam over the past few decades, changing into the liveable city that it is today. I worked extensively with Sustainable Amsterdam to showcase the positive message in their research and encourage people to learn more about the city and its transformation. My work on this video included scripting, recording, video editing and animation. The results have been published in many international media outlets and have appeared in conferences around the world.

the hague haag business association infographic

The Hague Infographic – Decisio

Decisio was asked by The Hague Business Association to research how the city ranks in suitability for establishment of international companies in comparison to other major European cities.  Decisio prepared a thorough report on the subject and asked me to participate. My responsibilities included visualising the data in an interesting and accessible way.  I made a series of infographics that illustrated the daily benefits that The Hague has in regards to housing, lifestyle, education, healthcare and connectivity to the rest of Europe. The infographic was prepared for digital publishing in reports and online, and also to be printed in poster format.


pop up cityscape animated gif

ENVD Animation – University Colorado Boulder

The University of Colorado, Boulder, has been the site of an intensive environmental planning programme, called ENVD, for many decades. The dean contacted me in order to make a 3-minute video to encourage prospective students to learn more about the programme and what skills the students could expect to learn in studies. For this project I helped with storyboarding, scripting, animation and editing.


Scape BV postcard

Scape Holiday Card

Scape is an Amsterdam-based branding and communications consultancy studio that focuses on enhancing the relationships between people, businesses and the built world.  To celebrate a successful year of work, relationships and new directions, Scape contacted me to work on a thank you card to send to all the people that made the year special. I worked alongside the team at Scape to capture their vision and goals in a fun and engaging way.


postcard Dutch cycling embassy

Dutch Cycling Embassy – Holiday Card

The Dutch Cycling Embassy is a platform established to spread Dutch cycling knowledge, innovation and expertise around the world by connecting partners to interested international third-parties.  To celebrate another successful year of work, relationships and new directions, DCE hired me to design a holidays card to send to those who made the year special. I worked alongside the team at DCE to capture the spirit of the platform while thanking those who participated.


siren seagull monitor title screen

North Sea Canal Animation – Urhahn Studio

Urhahn Stedenbouw is an urban design studio based in Amsterdam. Working with APPM, Decisio and various governmental bodies including Rijkswaterstraat, Urhahn was hired to make a strategic plan for the spatial intensification the Noordzeekanaal.  Once the report was completed, a summit was scheduled to exhibit the plan to the various stakeholders. The team at Urhahn contacted me to make a two-minute animated infographic covering the key points of the report to be presented at the summit. My responsibilities included storyboarding, illustrating, animating and audio engineering.


animated map gif seagull siren alarm going off animation gif